

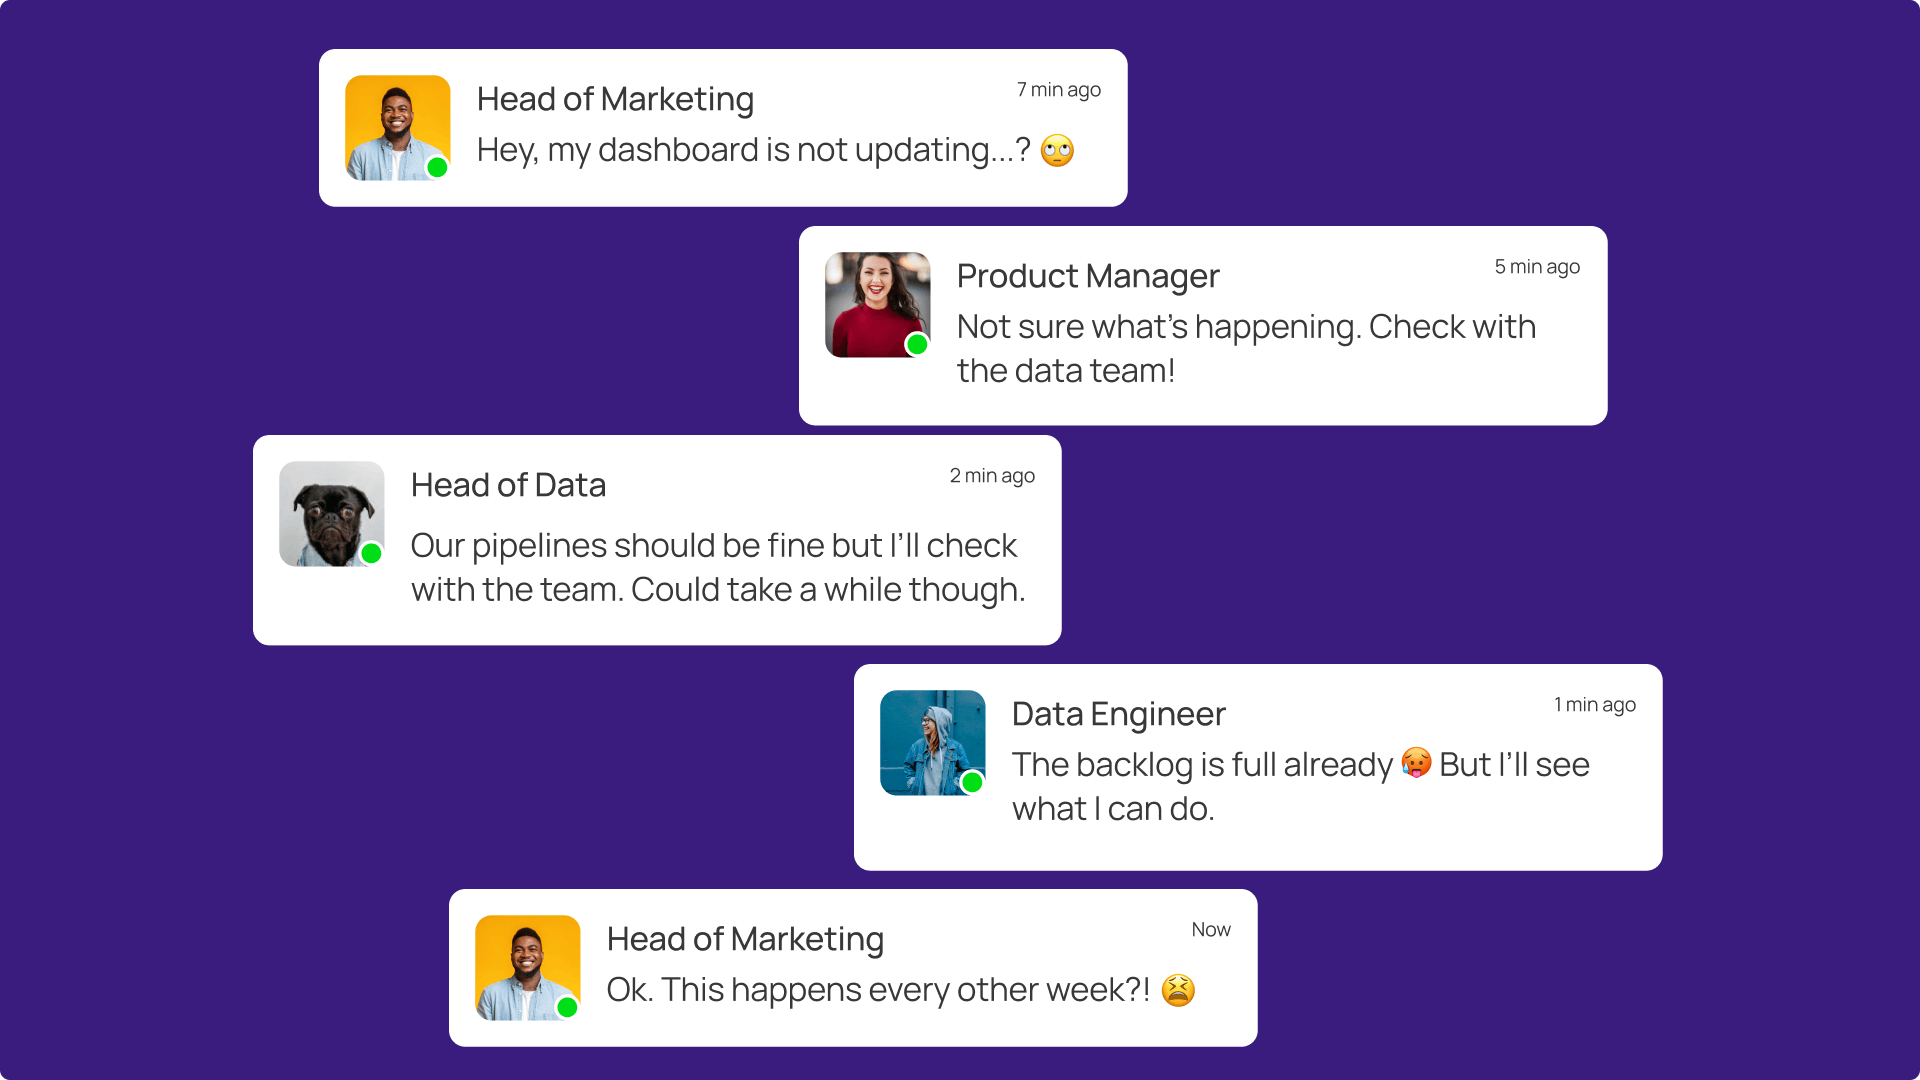
“Hey, I’m about to go into a meeting but the campaign dashboard is still not updating?”
Does it ring a bell? Ask most data teams about their biggest fears and they’ll often point to the dreaded “stale dashboard” scenario: the data feed stops updating altogether, leading to obviously out-of-date graphs that triggers urgent escalations. Painful? Absolutely. But at least they’re easy to spot—everyone can see that today’s dashboard is showing last week’s data. You know what is way worse?
A metric that looks just a bit off. Real-estate marketplace Zillow started investing in homes based on their AI driven “Zestimate” valuations. This eventually cost the company $304 million, because the estimates were slightly higher than traditional valuations, meaning they overpaid slightly for homes over the course of a couple of months.
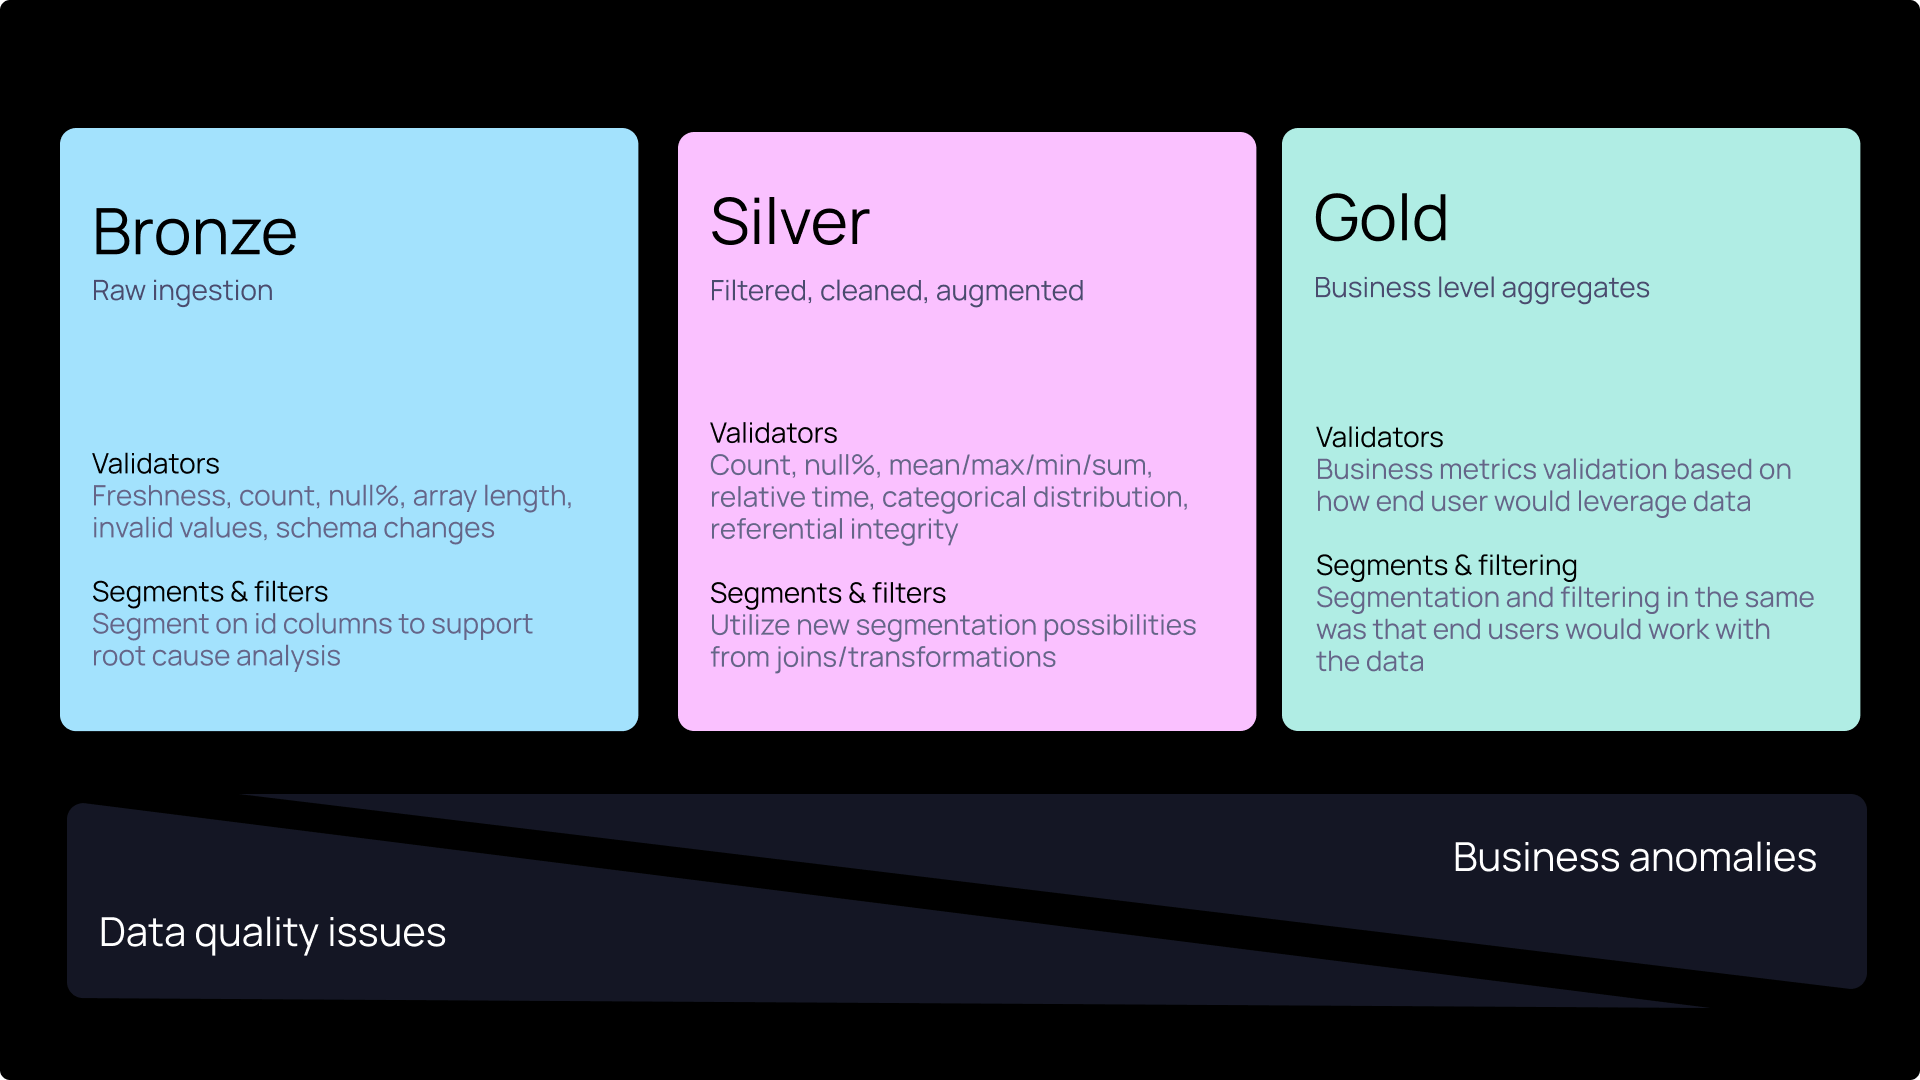
These types of issues are subtle enough to go unnoticed for weeks or months. Maybe a seemingly smooth migration from a source database to the warehouse introduced duplicate values in fields that were supposed to be unique—no alarms went off, but eventually, someone realized the numbers didn’t add up. The result? Employees either lose trust in the data or, worse, significant losses appear. By the time someone finally notices that “things look weird,” the damage is already done.
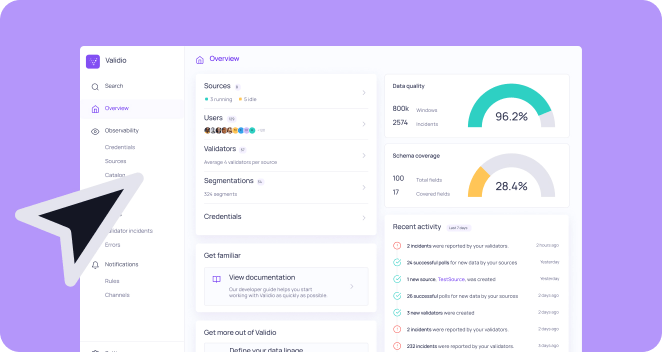
To tackle this, many companies are adopting observability practices, and while there are as many definitions for data observability as there are posts about AI on LinkedIn, we’ll break down the most important components in this article.
🚩 TABLE OF CONTENTS
→ Fighting data issues at scale